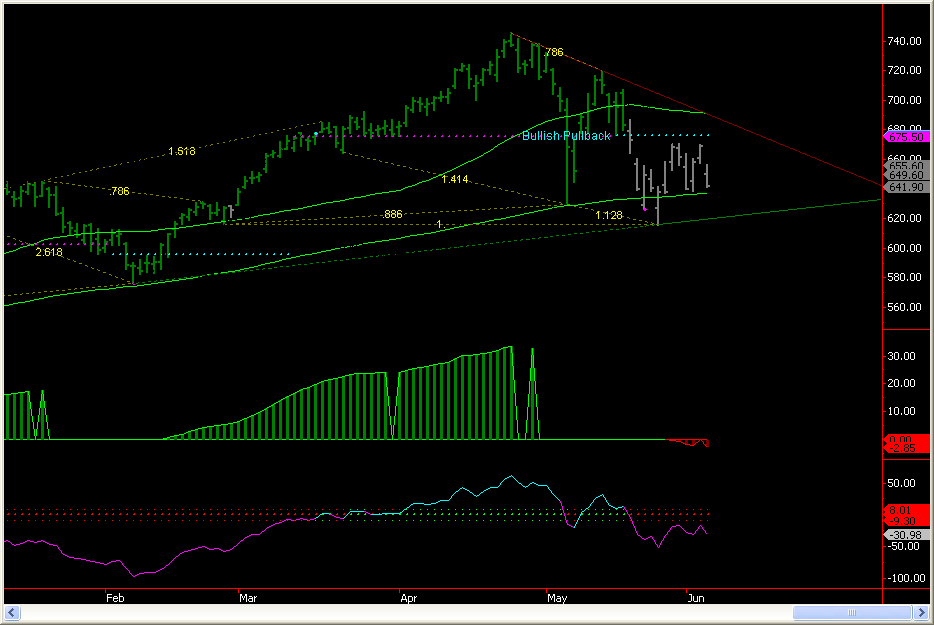
The TF chart above shows us in a confirmed downtrend and the resistance area that I cited previously (Blue dots) was indeed serious resistance and rejected.
Another Warning sign is that the TNA to TZA ratio is very expensive meaning that its especially expensive to be going long here and there is still a fair amount of selling pressure in the market.